Every few weeks a client sends me a TikTok Ads screenshot with the same question: “Is a 0.6% CTR good?” And every time, I give the same answer they don’t love. On TikTok, “good CTR” is the wrong question. It’s a creative signal, not a scorecard, and the accounts that treat it like a scorecard end up buying cheap clicks that don’t turn into customers.
This came up again because a widely shared benchmark guide is making the rounds. It’s a reasonable primer on what CTR is and how to calculate it. It also quotes in-feed CTRs of 1.5–3%, TopView CTRs of 12–16%, and industry averages of 0.25–1.03%, all in the same article. Those numbers can’t all describe the same thing. That contradiction is the whole story.
What the 2026 data actually says
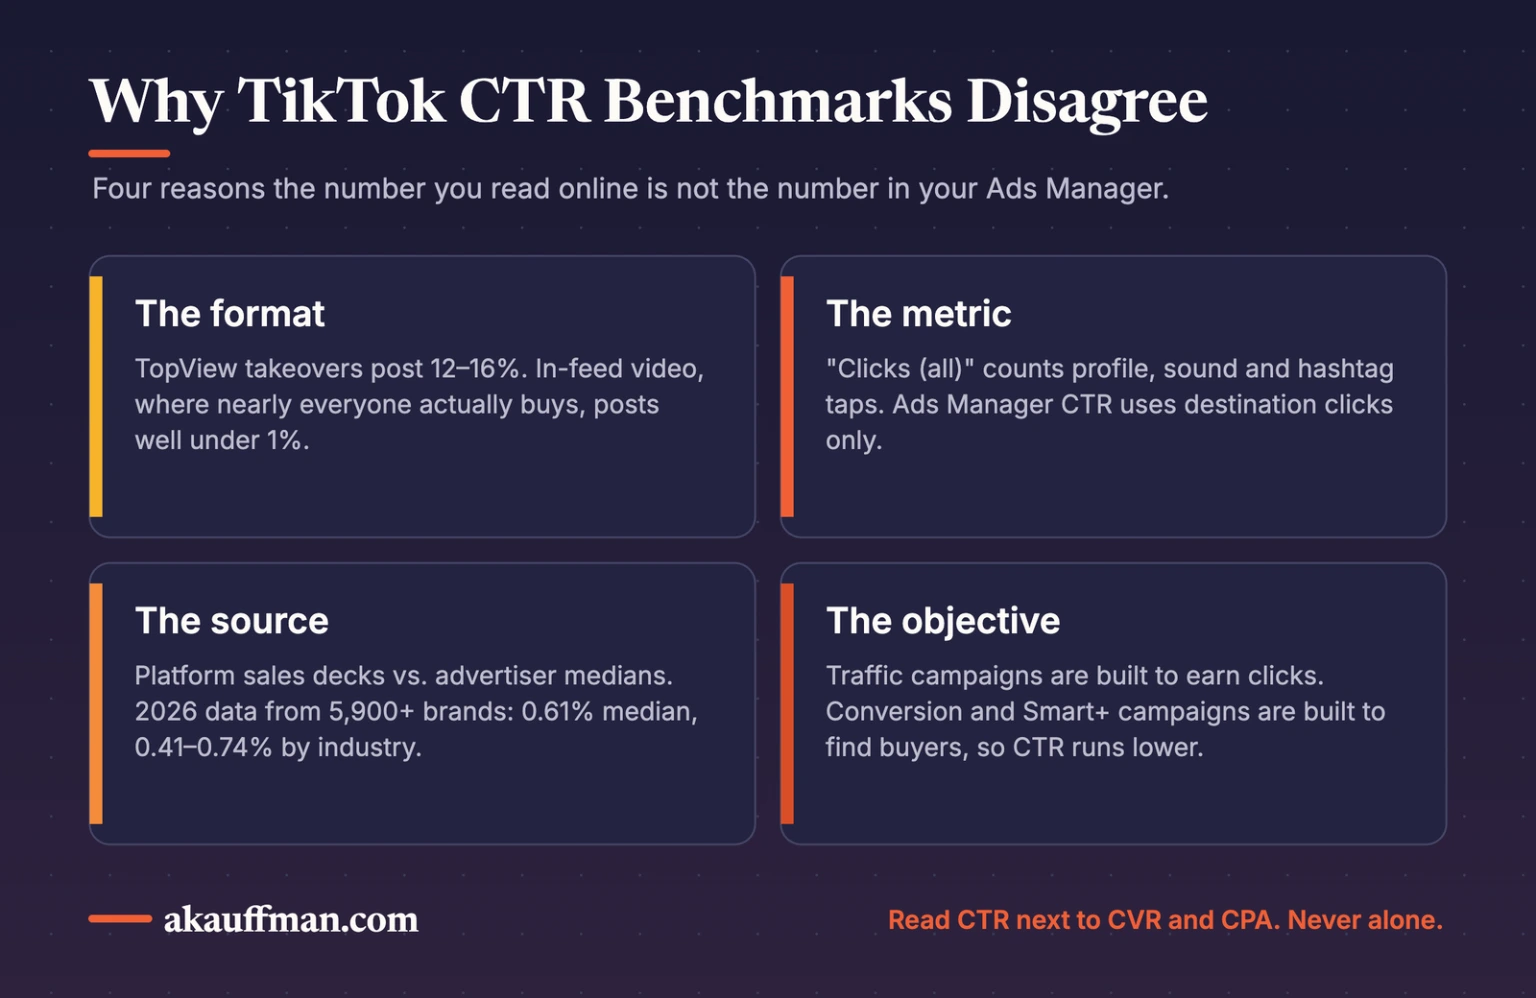
The freshest primary data I’ve found is Triple Whale’s TikTok benchmark report, published September 3, 2026, covering 5,900+ brands from August 2025 through July 2026. The median CTR was 0.61%, down 12.5% year over year. By industry the spread was tight: Apparel & Accessories at the top with 0.74%, Pets & Animals at the bottom with 0.41%. Nobody cleared 1%.
Lebesgue’s 2026 update, drawn from conversion-optimized ecommerce campaigns, lands in the same place: 0.61% CTR, roughly $4.80 CPM, 1.92% conversion rate. Two independent datasets, same answer. For real advertisers running real conversion campaigns, the median TikTok CTR is a bit over half a percent.
So where do the 1.5–3% and 12–16% figures come from? Mostly from older platform sales material describing premium formats (TopView is a full-screen takeover at app open, and TikTok charges accordingly) and from blended “all clicks” numbers that count profile taps, sound taps, and hashtag taps. TikTok Ads Manager’s default CTR metric uses destination clicks only. If you’re comparing your destination CTR to a benchmark built on all clicks, you’ll always look like you’re losing.
Why TikTok CTR is structurally low, and why that’s fine
TikTok is a full-screen, sound-on, autoplay video feed. The ad’s job is to survive the swipe, not to earn a click in the first second. Users engage with the video (they watch, like, comment, share, and tap the profile) far more than they leave the app. Triple Whale says it plainly in their report: lower CTR is expected behavior for the format and does not, by itself, mean underperformance.
Compare that to Search, where a click is the entire point and a 6% CTR is ordinary. Applying a Search mindset to TikTok is like judging a billboard by how many people pull over.
This is the same shift I wrote about on Meta, where creative now determines who sees your ad. On TikTok that’s been true for longer. The algorithm reads early engagement, watch time in particular, and decides who gets the next impression. CTR is downstream of that.
The balanced take
CTR still matters. It’s the fastest read you have on whether a hook and an offer are landing, and TikTok’s auction does reward ads that people interact with, so relevance lowers cost. If one creative pulls 0.9% and its sibling pulls 0.3% on the same audience, that’s real information. Use it.
Here’s the trap. CTR is the easiest metric to move without moving the business. Curiosity hooks, “wait for it” edits, and misleading thumbnails will double your CTR in a week. They’ll also fill your landing page with people who wanted a punchline, not a product. That shows up as a rising CTR and a collapsing conversion rate, and the account “looks better” right up until someone checks CPA.
The 2026 numbers are a warning here: CTR fell 12.5% while conversion rate fell 37%. I won’t claim one caused the other, but it’s a reminder that the two move independently, and the one that pays the bills is the second one.
On TikTok, CTR tells you whether the creative worked. It doesn’t tell you whether the campaign did.
What to do instead (in this order)
1. Benchmark against yourself, not the internet
Your last 90 days, by campaign objective, by creative. A published median blends thousands of accounts with different offers, price points, and objectives. Your own trend line is the only benchmark that’s actually apples to apples.
2. Read CTR with CVR and CPA, never alone
Build a simple three-column view: CTR, conversion rate, cost per result. A creative that wins on all three is a winner. A creative that wins on CTR and loses on the other two is clickbait, and you should kill it even though the dashboard looks good.
3. Put a hook metric above CTR
Track 2-second and 6-second view rates (TikTok reports both) as your thumbstop signal, and treat CTR as the second gate. If the hook rate is low, no CTA will save it. If the hook rate is high and CTR is low, the offer or the call to action is the problem, not the creative. Diagnosing in that order saves weeks of the wrong tests.
4. Make sure you’re comparing the right CTR
Check whether the number you’re looking at is destination clicks or all clicks. In Ads Manager, CTR is destination-based by default; some third-party dashboards and most “benchmark” posts aren’t. Fix the definition before you fix the ad.
5. Match the objective to the metric
If you’re running Traffic campaigns, CTR is the objective and a high number is legitimate. If you’re running Conversions or Smart+ campaigns, the algorithm is deliberately finding people likely to buy, not people likely to click, and you should expect a lower CTR. Judging a conversion campaign on CTR is grading it on a test it wasn’t taking.
6. Send the click somewhere that can convert
A 0.6% CTR on a mobile page that loads in five seconds is a wasted click. Speed, one clear offer, and a form or checkout that works with one thumb will do more for your cost per lead than any hook. This is the same lesson as ranking on Maps without the phone ringing: visibility is the input, conversion is the job.
My POV
When a client asks “is my CTR good,” what they’re really asking is “is this working.” A vendor answers the first question with a benchmark chart. A partner answers the second one, and that means pulling CPA, conversion rate, and the actual revenue in the CRM before saying a word about clicks.
I’d rather run a 0.5% CTR campaign that books jobs than a 2% campaign that fills a spreadsheet with tire-kickers. So would you. The benchmark that matters is the one on your P&L.
The bottom line
In 2026 the median TikTok CTR is about 0.6%, the industry range is roughly 0.4–0.75%, and anything above 1% on a conversion campaign is unusually strong. Use those numbers to sanity-check, not to celebrate or panic. Then go look at what happened after the click, because that’s where the money is.
Related reading: On Meta, your creative now determines your target audience · A health check for your target ROAS and CPA
Want a second opinion on your TikTok numbers?
I’ll look at your last 90 days across CTR, conversion rate, and cost per result and tell you, in plain terms, whether the channel is working. Book a call and bring the screenshot.